Drones for Photovoltaics
Thermal Imaging Inspection of Photovoltaic Farms
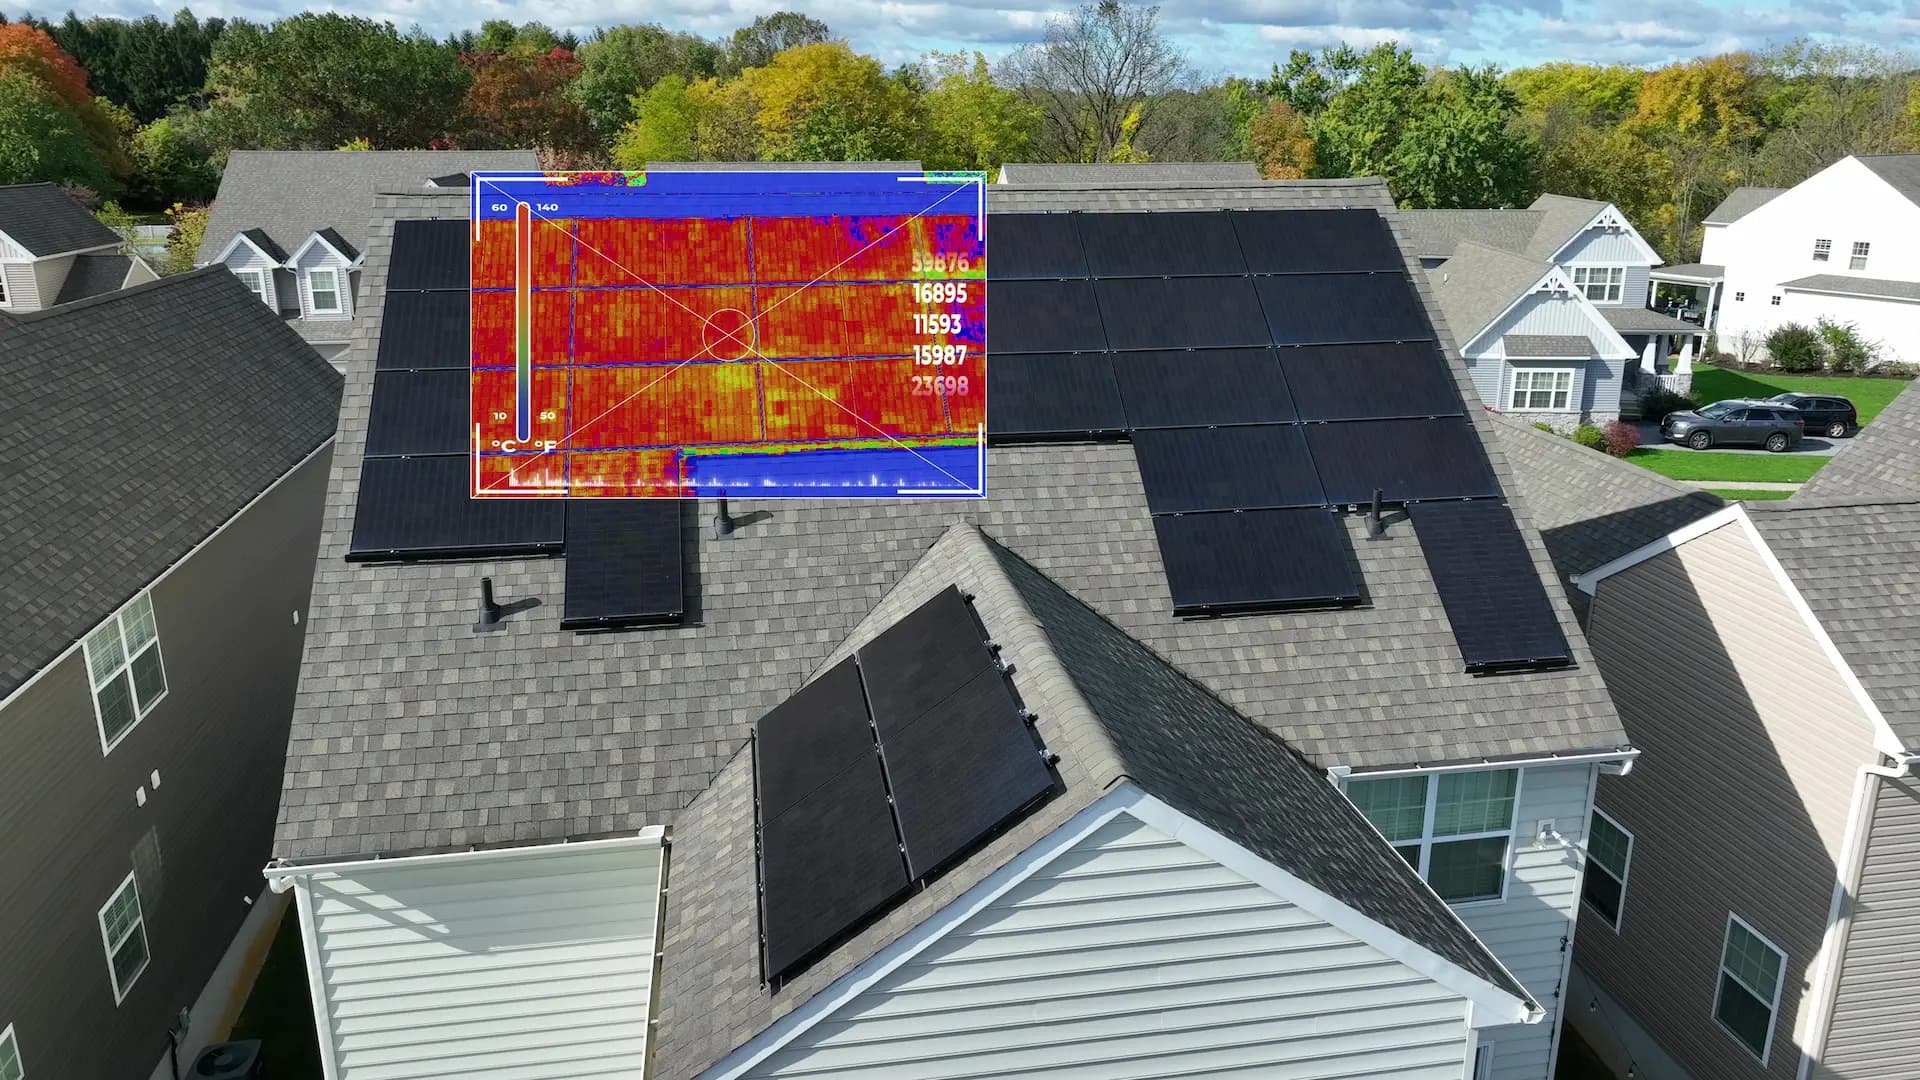
Drone thermal imaging of PV panels detects hot-spots, damaged cells and micro-cracks in hours instead of days. No system shutdown, no roof walking required.
1280×1024
Thermal resolution
< 0.05°C
Detector sensitivity
1 MW/h
Inspection throughput
24h
Report ready
What does a drone PV inspection cover?
Hot-spot diagnostics
A hot-spot is an overheated photovoltaic cell — causing efficiency loss and fire risk. The drone thermal camera identifies every hot-spot in seconds.
Damaged cell detection
Short circuits, open circuits and PID degradation visible as thermal anomalies. We identify faulty panels down to individual cells without module removal.
Electrical connection inspection
Overheated MC4 connectors, damaged bypass diodes and faulty strings visible on thermograms. Early intervention prevents fires and costly failures.
Visual installation documentation
Complete photo documentation of the PV farm: RGB images of every panel, installation orthophoto and mechanical inspection (glass cracks, soiling, shading).
IEC 62446-compliant report
Inspection report meeting IEC 62446-3 requirements for photovoltaic system inspection using airborne infrared thermography.
Yield loss analysis
Comparing thermograms with inverter data links thermal anomalies to energy production drops and estimates financial losses.
Who benefits from drone PV inspection?
Manual inspection of a 1 MW PV farm takes weeks with a meter and a handheld thermal camera. A drone does the same job in one hour — with better accuracy, as it views every panel from the optimal angle. Zero roof walking, zero risk, full documentation of every module.
Get Free QuoteHow does a drone PV inspection work?
Schedule planning
We set the optimal flight date — minimum 600 W/m² irradiance, no clouds, wind below 5 m/s. The installation must be under load (grid-connected).
Thermal flight
The drone with FLIR thermal camera (1280×1024 px) flies over the installation capturing thermal and RGB images simultaneously. Every photo is GPS-geotagged.
Anomaly analysis
We classify thermal anomalies per IEC 62446-3: hot-spots, damaged diodes, faulty strings. Each anomaly mapped to farm layout location.
Report and fault map
PDF report with thermograms, RGB photos, anomaly classification, fault map on farm layout and energy production loss estimate.
Drone applications in photovoltaics
Frequently asked questions — photovoltaics
Must the PV installation be shut down during inspection?
What weather conditions are required?
How many panels can a drone inspect per hour?
What is a hot-spot and why is it dangerous?
Does the report comply with industry standards?
How much does a PV farm thermal inspection cost?
Can I compare installation condition with previous inspections?
Ready to get started?
Contact us and we'll send you a quote within 24h.